How to measure the success of your app marketing efforts

Allocating marketing spend can be difficult without being able to accurately attribute success to marketing activities.
And with so many paid promotion options available to drive downloads of your app, it’s important to know which ones are worth the investment and which aren’t cutting it.
In this blog post we’ll take a dive into the analytics features for your app stores and show you exactly what you need to look for to make sure you’re getting the best ROI for your app marketing efforts.
Track how your app is discovered in the app stores
With some 2.7 million apps available in the Google Play Store and 2.2 million in the Apple App Store, it’s a fierce battle to make sure yours appears at the top of the search results.
Cleverly crafted app titles, keywords, descriptions, and metadata are key to ensuring that your app shows up ahead of the competition’s. And carefully devised multi-channel paid promotions provide the backbone to your app marketing efforts.
But how do you know if what you’re doing is working?
This has now become much easier with the addition of some smart analytics available for both iOS and Android apps.
App Store Analytics
Apple recently released a couple of new user acquisition marketing features in their App Analytics toolkit called App Store Sources and App Referrers.
These features are available as standard for any app in the App Store, and allow you to track referral and source data to your app from 14 April 2017 onwards.
App Store Sources is a helpful tool for tracking how your app appears in the App Store based on a number of different metrics:
- Impressions – how many times your app has been displayed in the App Store
- Product page views – how many people viewed your app’s details page in the App Store
- App units – how many people installed your app from the App Store
This is broken down to four distinct areas:
- App Store browse – users who were browsing the App Store and found your app
- App Store search – users who searched the App Store and found your app
- App referrer – users who have been referred to your app by another app or ad in an app
- Web referrer – users who have been referred from a third-party website to your app
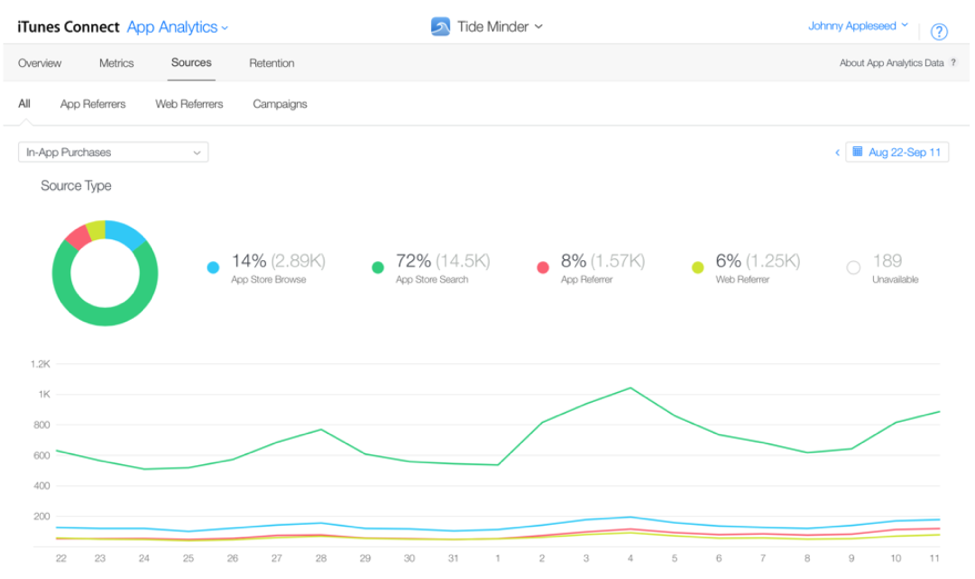
From here, you can dive deeper to see more information about exactly where your impressions and clicks came from.
Particularly useful are the App Referrers and Web Referrers tabs.
App Referrers
You can dig into the details of App Referrers by selecting it in the header menu under Sources.
This will show you the number of App Store app impressions and App Unit installs generated by any other third party apps, such as Facebook, Instagram, Mail, Twitter, Messenger, Pinterest or any other app that had a deeplink pointing to your app’s page in the App Store.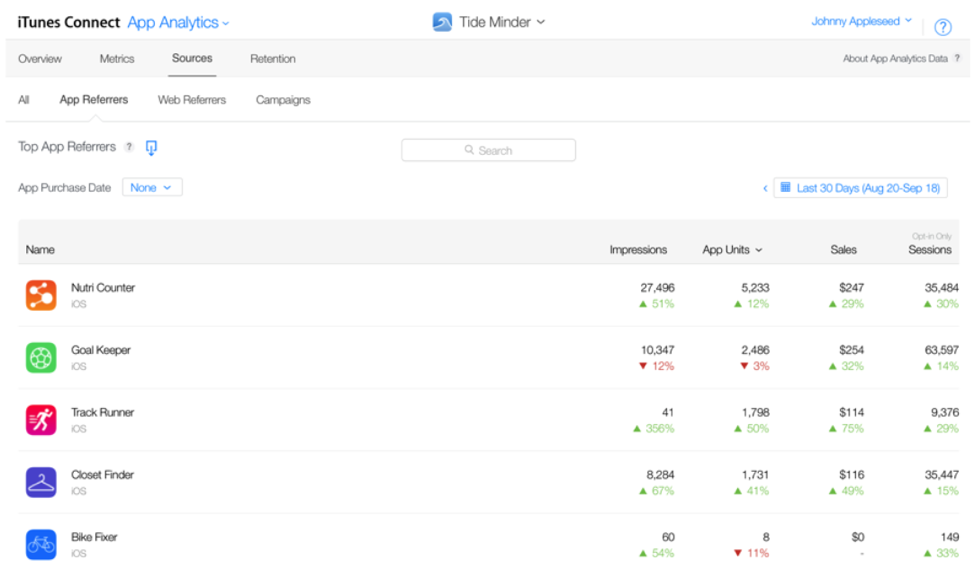
This data is hugely useful to identify how successful your marketing activities are, for example:
- Seeing how many users are coming from email apps and which email apps those are. This will help measure your email campaigns and email referral campaign successes.
- Seeing how many users are coming from different social media apps will tell you not only how successfully are you promoting your own app, but also where users share it the most.
Web Referrers
This works very much the same way as App Referrers but this section highlights which top domains drove traffic from the web browser to your app’s page in the App Store.
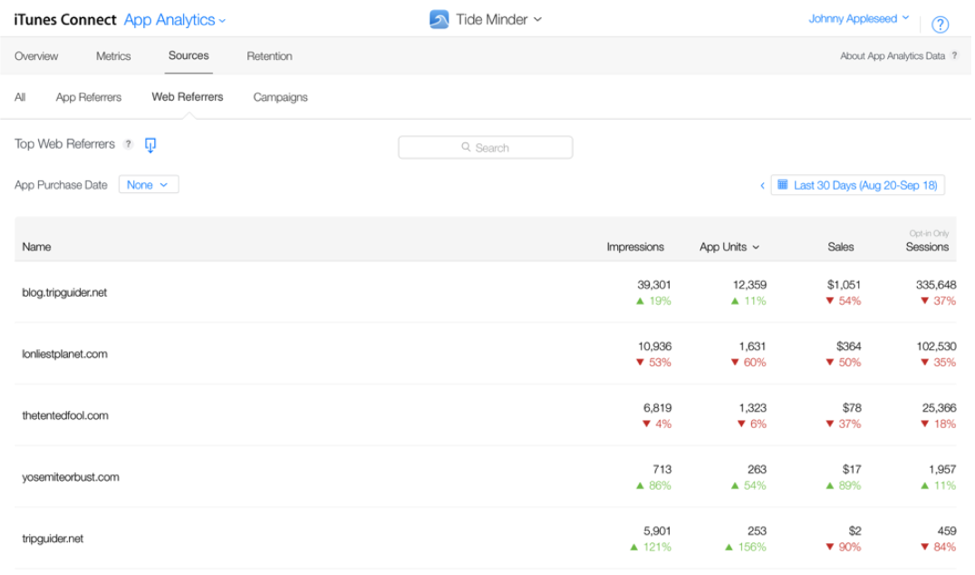
This will help you identify:
- How efficiently you drive traffic from web searches to app, which could help you understand how your search campaigns are performing.
- How efficiently you convert web users from your own domain to download your app. This is also a good way to understand how app banners and website deeplinks work in general.
Google Play Store Analytics
Google Analytics offers comprehensive data tracking for your Android app, to a huge degree of detail beyond simply the number of downloads your app has had, including:
- User demographics – use this to understand your target audience and segment to see if particular user groups are more engaged with your app than others
- See the actions users are taking in-app – find out if there are sticking points within the app that are causing drop-off
- Track in-app payments – directly measure how your app is performing as a retail channel
Sources and referrals
You can measure your source and referral data for Android apps in much the same way as iOS apps using Google Play Campaign Measurement in Google Analytics, provided you have installed the correct SDK.
For iOS devices, Google also offers to track the first session of the app use after an ad related installation, but this will require some changes to your app as explained here.
Using the Campaign Attribution, you can see which campaigns and sources (including websites and third-party apps) are referring users to your app in the Google Play Store.
In the same way that Apple’s Web and App Referrers analytics tools are helpful in showing you which channels are performing best, the Campaign Attribution tool allows you to see which apps or websites are driving the most traffic to your app in the Play Store.
The Campaign & Traffic Source Attribution enables you an additional degree of depth.
This tool allows you to see which campaigns or referrers lead users to launch the app after it is installed, helping you identify which sources provide the most high-quality referrals in terms of conversion rates.
Tracking campaigns
If you’re looking for more granular tracking, you can define your own campaign URLs within Apple App Analytics and Google Play Analytics.
This bespoke campaign tracking help you really understand how much bang you get for your buck when spending time and/or money on advertising, email campaigns and social media.
Additionally, to attribute actual post installation usage to app acquisition tools, you can also find data on Session, Active Users and Users who have been active in the last 30 days in both App Analytics and Google Play Analytics.
This will show you how much traffic you are currently getting from previous app acquisition campaigns and which source you can attribute it to.
It’s important to be aware that whilst Apple can track sources for all activity in the App Store, it can only gather usage related data from users who have opted in to share diagnostics data with Apple, so it will be a subset of your users only.
This opt-in ratio is typically within 10-25% so make sure you augment the usage data to the full user-base.
Go granular when tracking your app marketing efforts
Sources in App Analytics and Campaign Measurement in Google Analytics are great ways to get an overview all of your free and paid promotion efforts for your app in one place.
But if you want to dig deeper into what is impacting the performance of certain elements of your app acquisition, you should look at the analytics provided by your referrers too.
Google advertising (Display Network, AdWords and TrueView)
You are able to dig into the performance of your adverts in your AdWords analytics, and monitor by impressions, click-through-rate (CTR) and average cost-per-click (CPC).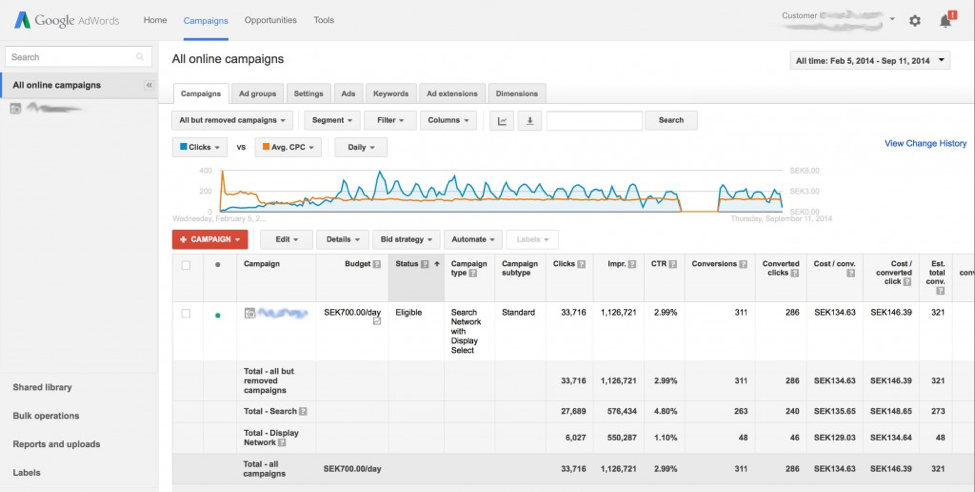
The AdWords dashboard gives you insights into huge amounts of data, which enables you to check which keywords or display ads are performing best for you. Use this to optimise your ads and test what performs best.
Facebook and Instagram advertising
Facebook offers its own analytics for tracking its mobile ad performance, both for the Facebook app and the Instagram app.
You can track both using the Adverts Manager or Analytics for Apps tool, and check the performance of both promoted posts and suggested apps.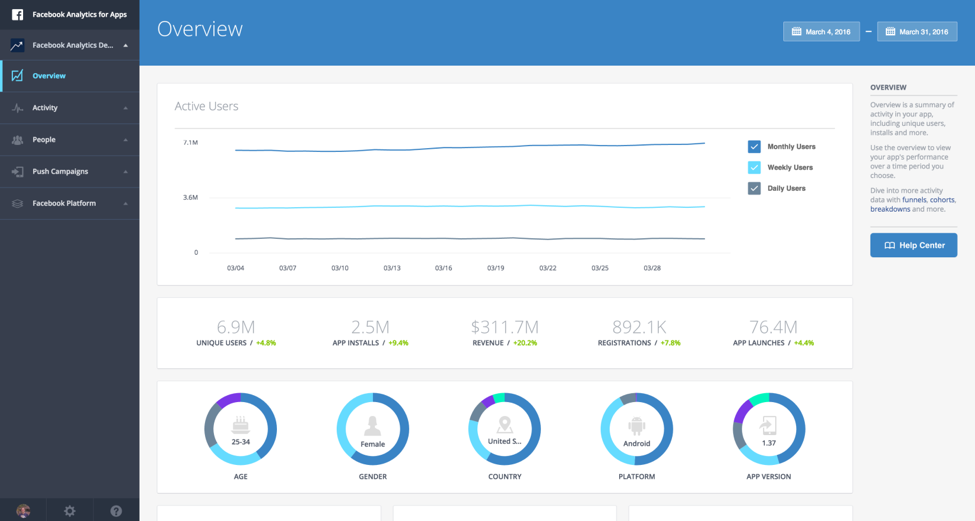
Here you can check to see if your targeting is performing as you’d like, and you can even see how many app installs and launches resulted from your Facebook advertising.
Twitter advertising
Twitter for Business has its own Campaign Dashboard that provides a great deal of detail on the performance of your sponsored tweets, hashtags or accounts.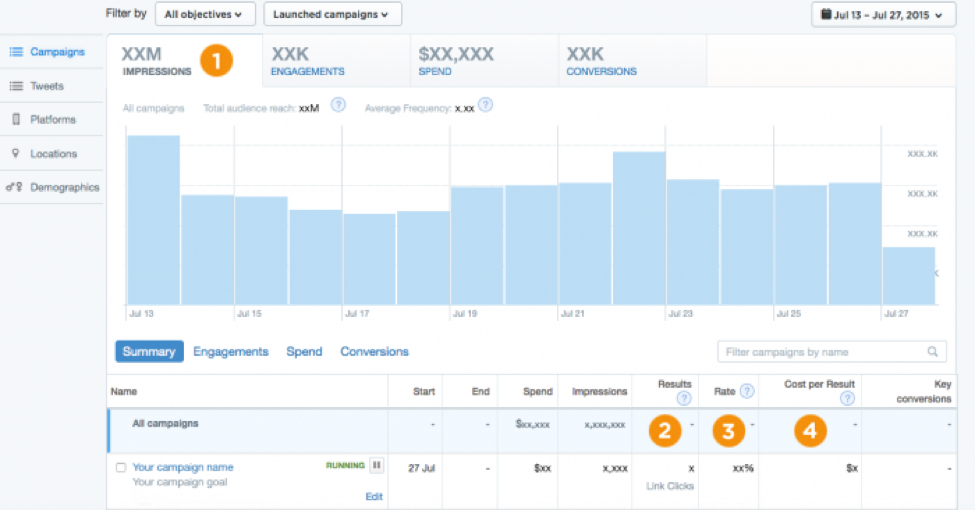
Check your overall campaign performance by cost and delve into individual tweets to see which have resonated best with your audience.
Snapchat advertising
Snapchat has recently begun to offer self-serve advertising, which comes with its own analytics dashboard.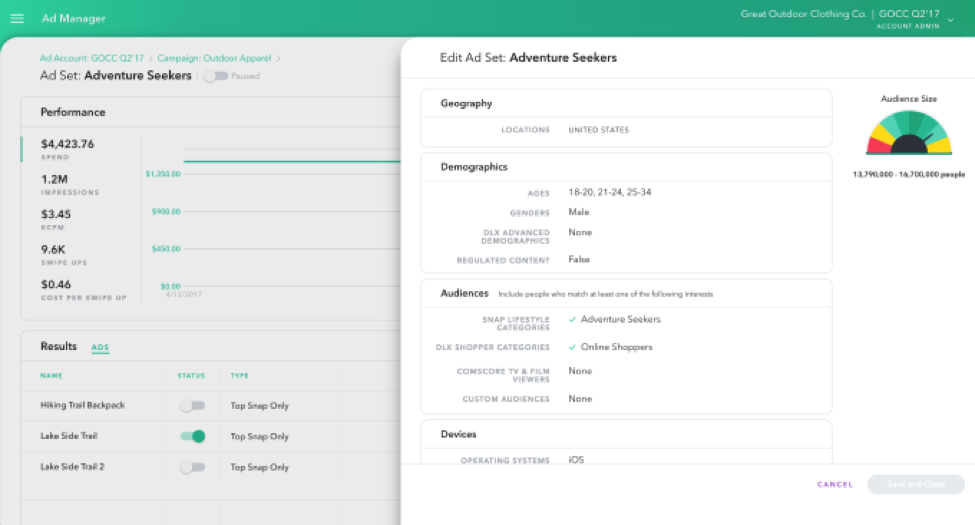
The dashboard offers insights into ad spend, impressions, swipe ups and costs per swipe up, and allows you to group sponsored snaps by campaign.
Data is power: Measuring success means more investment
With each platform offering its own in-depth analytics tool, and the addition of the App Store Source and App Referral features on the App Analytics, there really is no excuse to not measure the success of your app marketing efforts.
Once you’re armed with data, you’re able to optimise your app ad campaigns to gain higher conversion numbers and invest your paid promotion budget more wisely.
App marketing – stay up to speed
Marketing your app is integral to its growth and success. Due to the rapid development in this space, we imagine that plenty of other tools will surface with time.
You can rely on Poq to keep our ears to the ground and report back here on our blog. Sign up to our newsletter to stay up to speed.
Reported by Balint Szeplaki
You may be interested in...

iOS 26 Proves Apps Are Here to Stay – and Evolving Fast
Poq Spring/Summer ’25 Release: Unlocking the Next Level of App Engagement

Poq Appoints Brandon Sewell as Vice President of Sales and Partnerships, North America

